Figure scaling
In the early days of wordprocessing, and certainly with the advent of many new fonts, many of us were inclined to use as many different typefaces and as many different fonts as we could. Fortunately, we have come to the years of wisdom and now refrain to one or at maximum two or three typefaces in the same document (a serif font, a sans-serif font and a typewriter font).
With the advent of graphical packages (paint, photoshop, adobe illustrator, coreldraw, matlab, ...), unfortunately a lot of similar accidents happen.
A. Vector graphics vs. bitmap graphics
The first one is the most obvious one: use vector graphics wherever you can. They scale without becoming pixelated or blurry. In LaTeX, stick to PDF.
Luckily, I see this mistake being made less and less. My blood pressure thanks you all.
B. Inconsistent font sizes
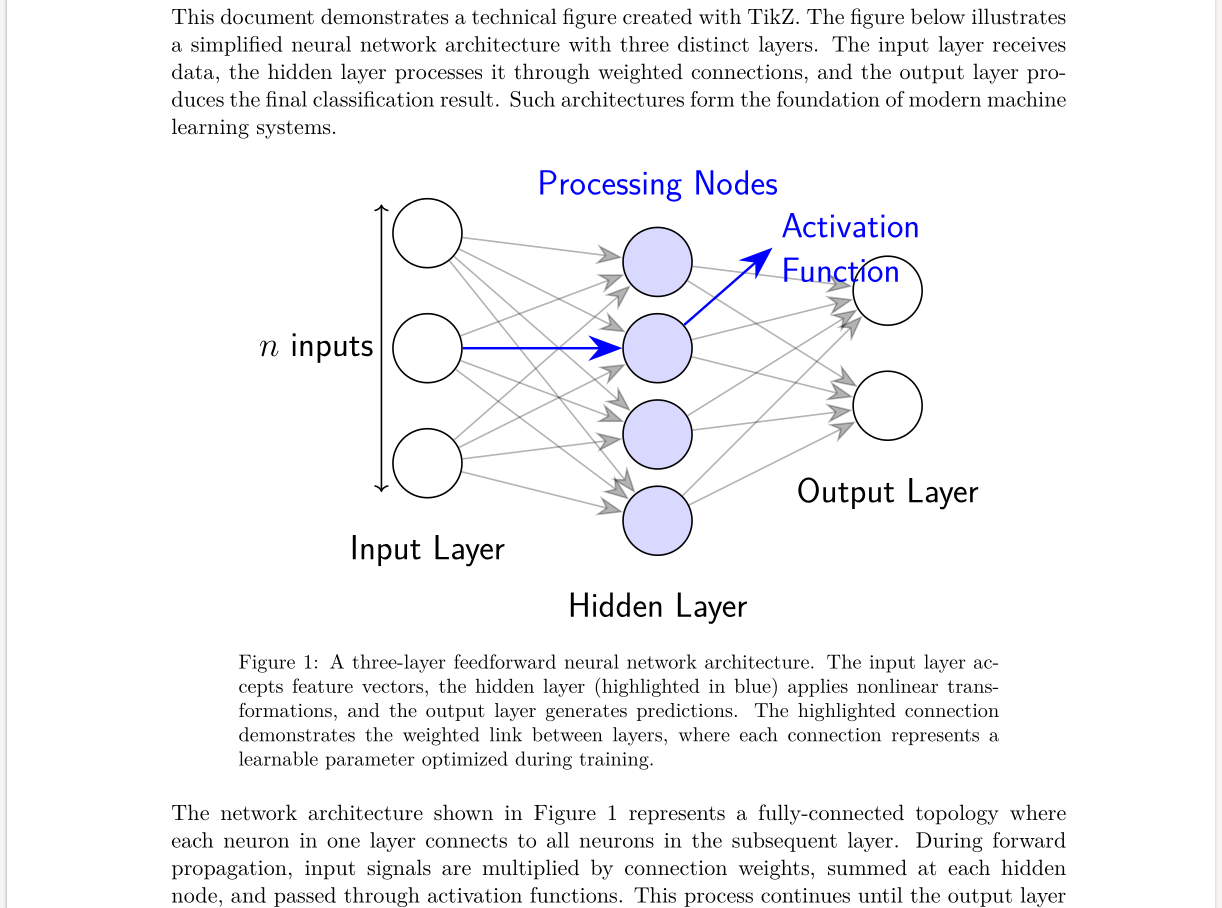
The second one, is - alas - far more common, and probably will be there for the rest of my life. It is inconsistent font sizes. Below you can find an example. I generated it with Claude after a figure I've seen in a scientific text that I had to review. Using a different font in the figure than in the text is still ok (though I'm not a huge fan of it), but the font size is appalling, especially if you see multiple of these figures each with a different font size.
There are three solutions: one is ok, the two other ones are better.
1. Be meticulously consistent
Always select the same font size in the drawing program you are using. Always include the images you create in your drawing program with the same scaling factor. Believe me, though it will lower my blood pressure, this way of working will drive you crazy.
2. Let LaTeX handle your text
The best option is to let your graphics program generate a file that has a LaTeX overlay for the text. Below you can find a list of the good options in this line of work:
- Inkscape: can export to PDF + LaTeX
- Matlab: has the matlab2tikz package that converts figures directly to TikZ code
- Mathematica: can export to EPS/PDF with text conversion options (e.g. with the MaTeX package)
- Matplotlib (python): exports directly to TikZ/PGFPlots
- Julia: PGFPlotsX.jl allows exporting to TikZ/PGFPlots
- R: the tikzDevice package converts plots to TikZ
Don't ask me how they work, as I don't use them myself. I use the third option.
3. Make your images in LaTeX
This is your best option. You might consider using TikZ, metapost, or any other good graphics language available in LaTeX. Most of them can read data and generate graphs of them. I especially like the combination of TikZ and PGFPlots. All the course texta and articles that I write, are made using this combo. Usually the text on your figures can be a little bit smaller than the main text, therefore using 'small' or 'footnotesize' text will yield very professional-looking graphics. And you can scale them at will without changing the figure's font size at all.